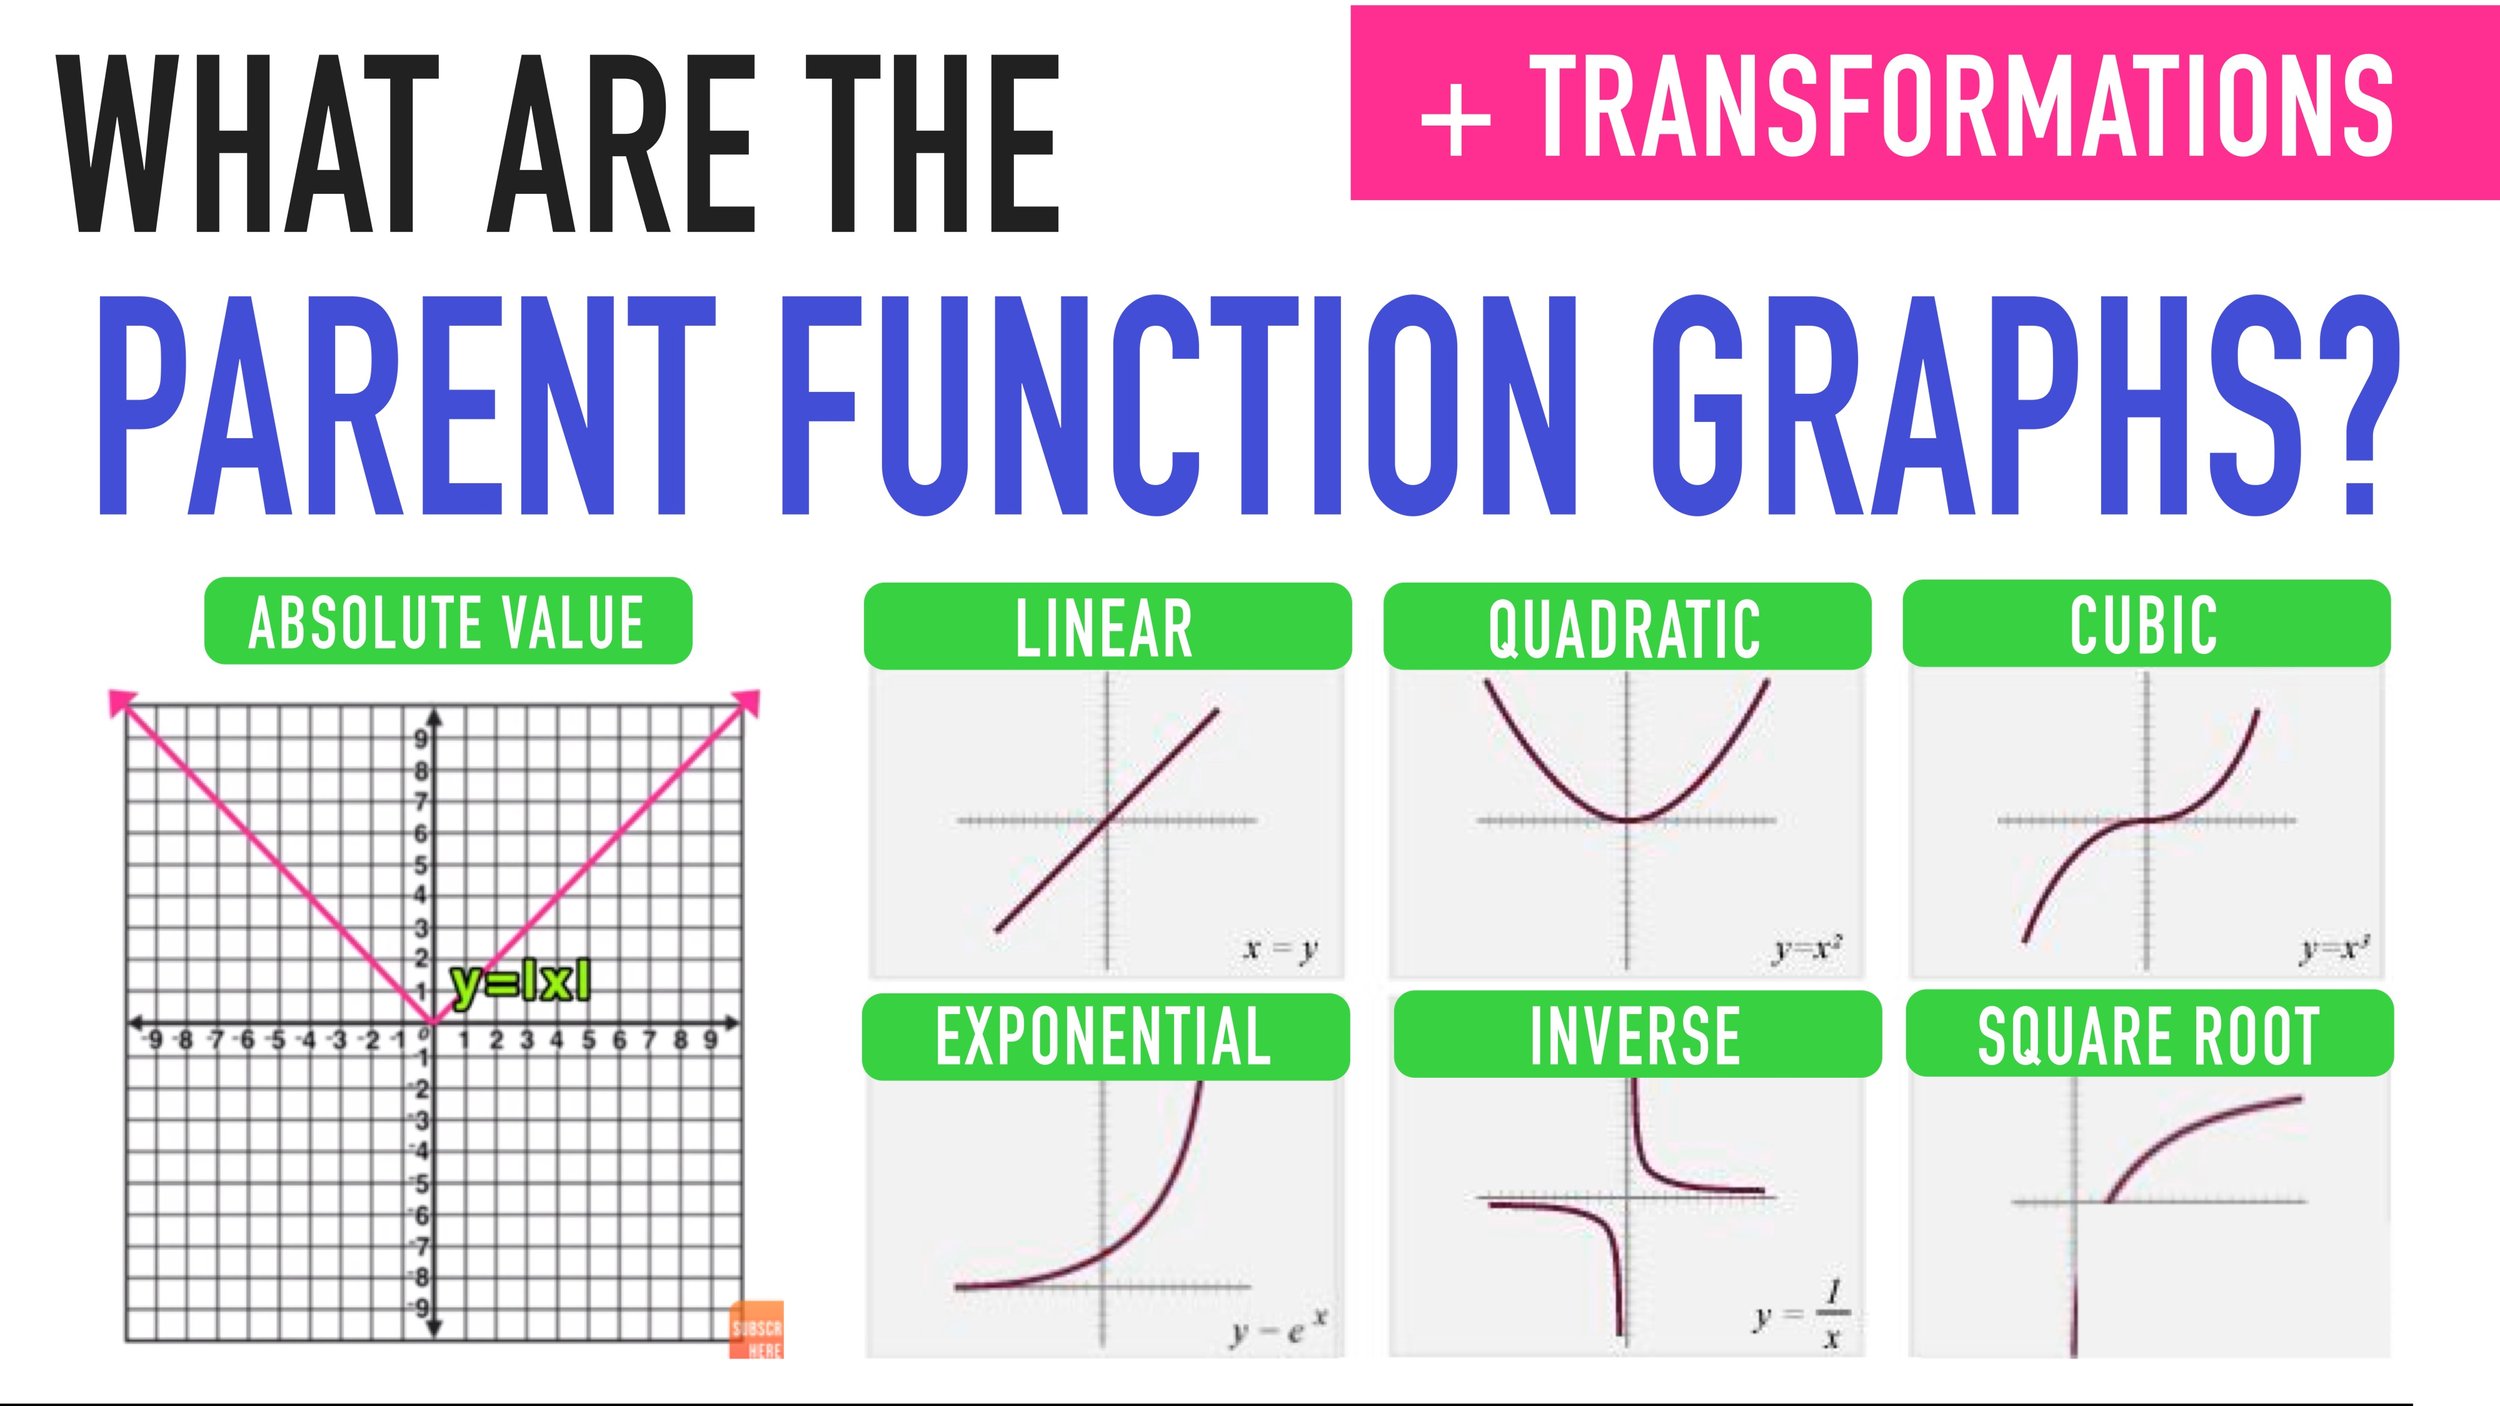
Graph of Parent Functions, A Visual Guide
Graph of parent functions provides a foundational understanding of function behavior. This exploration delves into the core concepts of various parent functions – linear, quadratic, cubic, exponential, and logarithmic – and how transformations dramatically alter their graphical representations. We’ll uncover how shifts, stretches, compressions, and reflections modify the parent function’s shape and position on the coordinate plane, leading to a deeper appreciation of function transformations and their applications.
Understanding parent functions is crucial because they serve as building blocks for more complex functions. By mastering the characteristics and transformations of these fundamental functions, we gain the ability to analyze and graph a wide range of mathematical expressions. This knowledge extends beyond theoretical mathematics, finding practical applications in fields like physics, engineering, and computer science.
Understanding Parent Functions and Transformations: Graph Of Parent Function

Parent functions are fundamental building blocks in mathematics, providing a basis for understanding more complex functions. They represent the simplest form of a particular function type, allowing us to analyze and predict the behavior of their transformed counterparts. This exploration delves into the core concepts of parent functions, their transformations, and their applications.
Defining the Parent Function, Graph of parent function
A parent function is the simplest form of a function within a family of functions. It serves as a prototype, exhibiting the core characteristics of that function type. Common examples include linear (f(x) = x), quadratic (f(x) = x²), cubic (f(x) = x³), exponential (f(x) = a x), and logarithmic (f(x) = log ax) functions. Understanding parent functions allows for a systematic approach to analyzing more complex functions derived from them through transformations.
These transformations alter the graph of the parent function, producing variations while retaining the underlying characteristics of the original function type.
Transformations of Parent Functions
Transformations systematically modify a parent function’s graph. Vertical shifts move the graph up or down along the y-axis. Horizontal shifts translate the graph left or right along the x-axis. Vertical stretches and compressions alter the graph’s vertical scale, while horizontal stretches and compressions affect its horizontal scale. Reflections across the x-axis or y-axis flip the graph across the respective axes.
A step-by-step process for applying these transformations involves systematically applying each transformation in the order of operations, considering the impact of each on the parent function’s graph.
Planning a family movie night? You might want to check out the Asteroid City parents guide first to see if it’s suitable for your kids. Knowing the content beforehand is always a good idea, especially with Wes Anderson films. Speaking of planning, if you’re curious about genetics, a handy tool is the blood type by parents chart , which can help predict a child’s blood type based on the parents’.
It’s surprisingly interesting to see how inheritance works!
Graphing Transformed Functions
Graphing a transformed function begins with identifying the parent function and the transformations applied. A procedure for accurately plotting key points involves applying the transformations to specific points on the parent function’s graph. Determining the domain and range of a transformed function requires considering how the transformations affect the original function’s domain and range. The domain represents the set of all possible input values (x-values), while the range represents the set of all possible output values (y-values).
Transformations can expand or restrict these sets.
Applications of Parent Functions and Transformations
Parent functions and their transformations find extensive use in various fields. In physics, they model projectile motion, exponential growth/decay, and oscillatory phenomena. In engineering, they describe the behavior of circuits, structural components, and control systems. Understanding parent functions is crucial for problem-solving in these and other fields because they provide a framework for analyzing and predicting the behavior of complex systems.
Comparing Different Parent Functions and their Graphs

Linear functions exhibit a constant rate of change, resulting in a straight line graph. Quadratic functions, characterized by a squared term, produce a parabolic graph. Exponential functions show rapid growth or decay, while logarithmic functions represent their inverse relationships, exhibiting slow growth. Polynomial functions of varying degrees display diverse graph behaviors, with the degree influencing the number of turning points and end behavior.
Planning a family movie night? You might want to check out the Asteroid City parents guide first to make sure it’s suitable for everyone. It’s always good to be prepared, especially with kids! Speaking of planning ahead, if you’re curious about genetics, a handy tool is the blood type by parents chart , which can help predict your child’s blood type based on yours and your partner’s.
Knowing this beforehand can be helpful for various reasons.
Advanced Transformations and their Graphical Representations
Piecewise functions consist of multiple function segments defined over different intervals, leading to graphs with distinct sections. Combined transformations, such as a vertical shift followed by a horizontal stretch, require a sequential application of the individual transformations. Analyzing complex transformations involves breaking them down into individual components and applying them systematically to generate the final graph.
Creating a Parent Function Graphing Guide
Graphing parent functions and their transformations begins with identifying the parent function. A step-by-step process involves plotting key points of the parent function, then applying the transformations to these points to obtain corresponding points on the transformed function’s graph. Critical features to include in the sketch are intercepts (x and y), asymptotes (if any), and the overall shape and behavior of the graph.
Accuracy and efficiency in plotting points are crucial for a clear and accurate representation of the function.
In conclusion, the study of parent functions and their transformations offers a powerful tool for understanding and visualizing mathematical relationships. From the simple linearity of a straight line to the exponential growth curves found in nature, the ability to identify and manipulate parent functions provides a versatile framework for solving complex problems across various disciplines. By grasping the core concepts Artikeld here, you’ll gain a stronger foundation in mathematical analysis and visualization.
Share this content:
